Case Studies

Session Analysis

Real sessions where the model's pre-market read played out intraday. Each case documents what the data showed before the open and how price responded — both validations and failures.

Critical Fragility Full Cascade S0–S5 Broken V-Shape Recovery

June 9, 2026 — Cascade & Recovery

GEX score 10 · Prior close $0.06 above flip · All six support levels broken · LOD $722.59 · Full V-shape recovery

Model result Validated
Pre-market model read — 9:08 AM ET
GEX Score
10
Critical Fragility
Gamma Flip
$739.25
Prior close $739.31
Only $0.06 above
Net GEX
−$8.6M
Deeply short gamma
Model Dollar SD
$6.80
Session used 3.6× SD

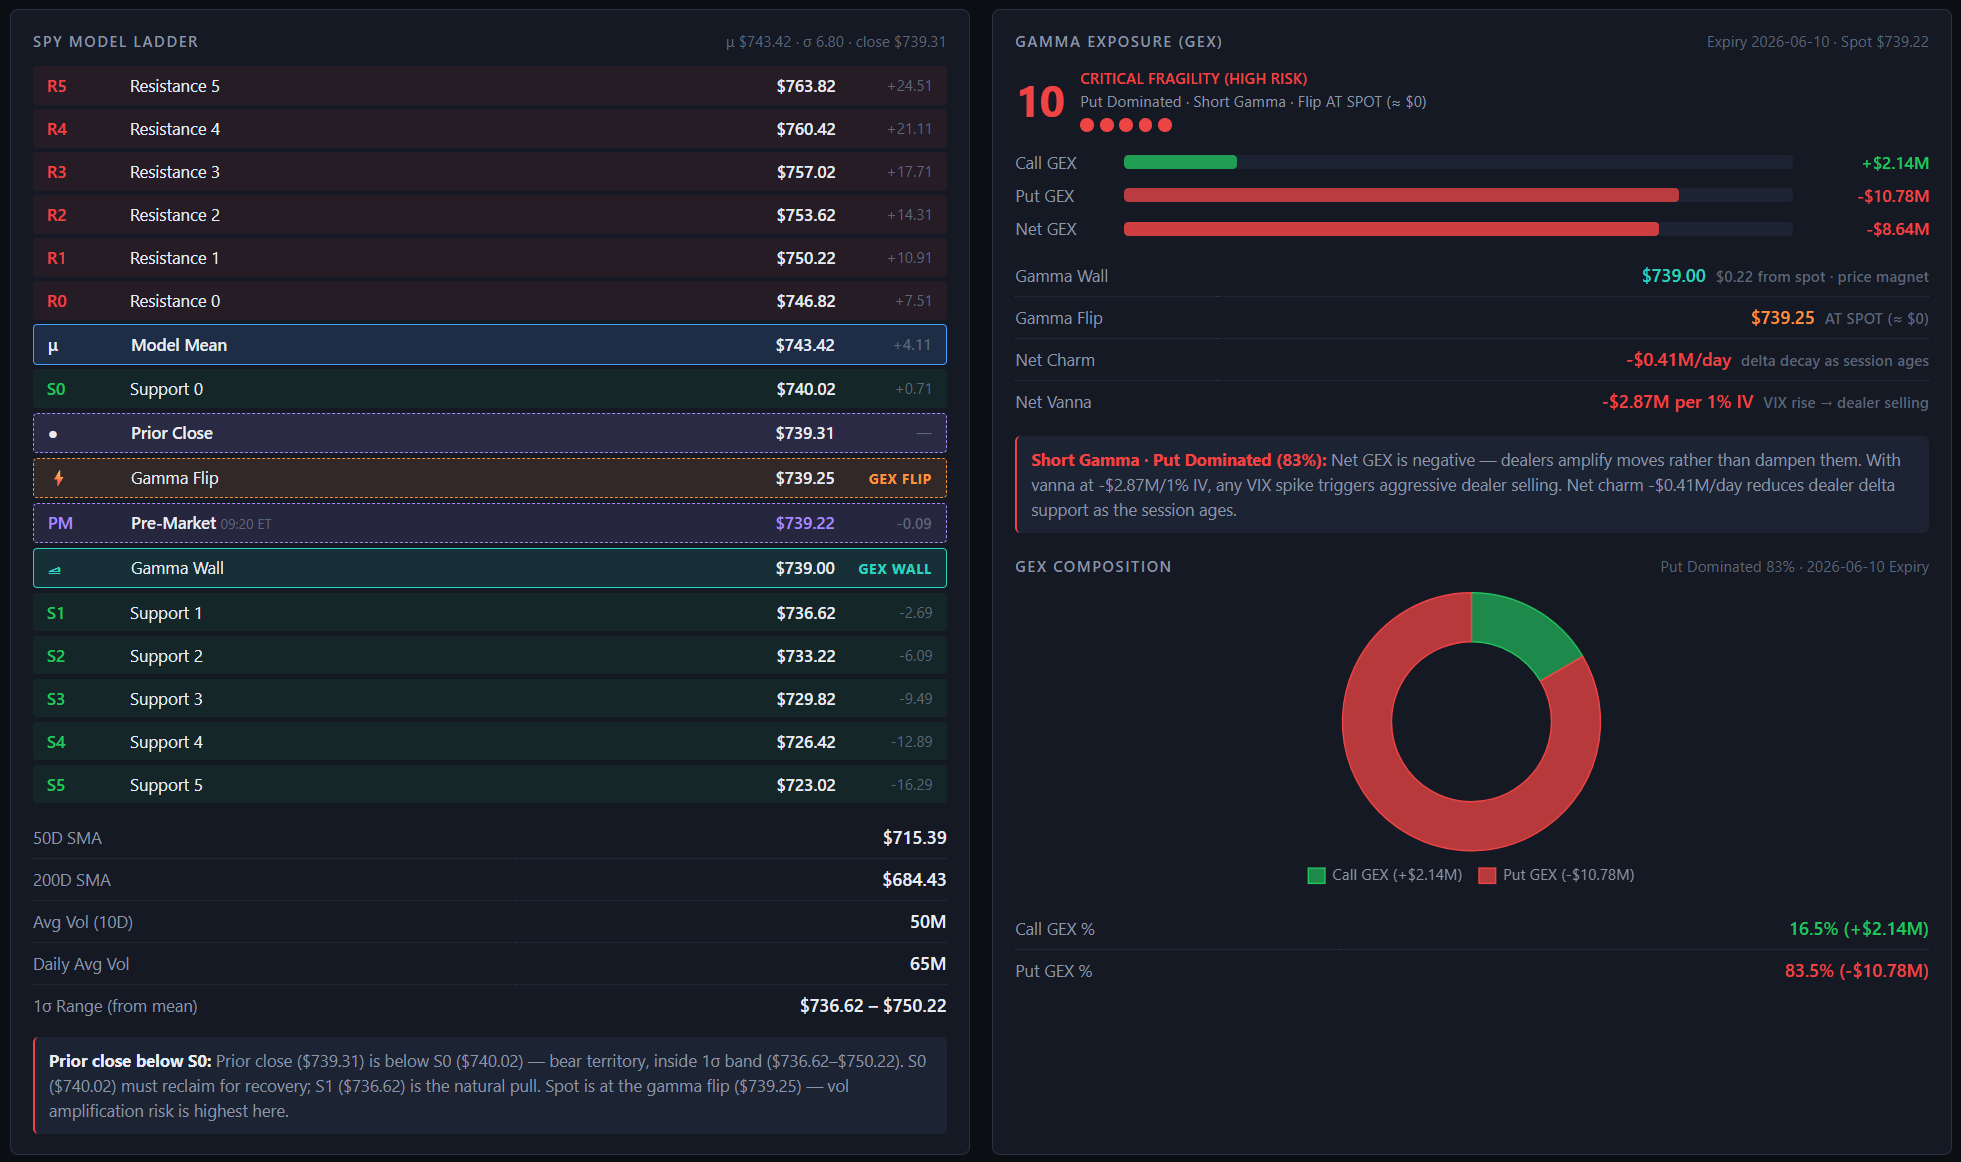
Before a single candle printed: GEX score at the maximum (10), prior close sitting $0.06 above the gamma flip, gamma wall at $739.00 below both price and the flip. The structural read was unambiguous — the session was one catalyst away from a full negative gamma cascade with no margin of safety below the flip.

Market Sentiment Dashboard — morning of June 9
Market Sentiment Dashboard June 9 2026
Market Sentiment Dashboard · June 9, 2026 · Generated 9:15 AM ET · Sentiment score 59 (Neutral) · GEX Critical Fragility flagged
Full session — 5-minute SPY chart with Pine Script model levels
SPY 5-minute chart June 9 2026 showing full cascade and V-shape recovery
SPY 5-min · June 9, 2026 · Full session · HOD $746.90 · LOD $722.59 · Close above S1 $736.62 · R0 (red) · Mean (blue) · S0–S5 (green) · VWAP (orange) · Complete cascade and V-shape recovery

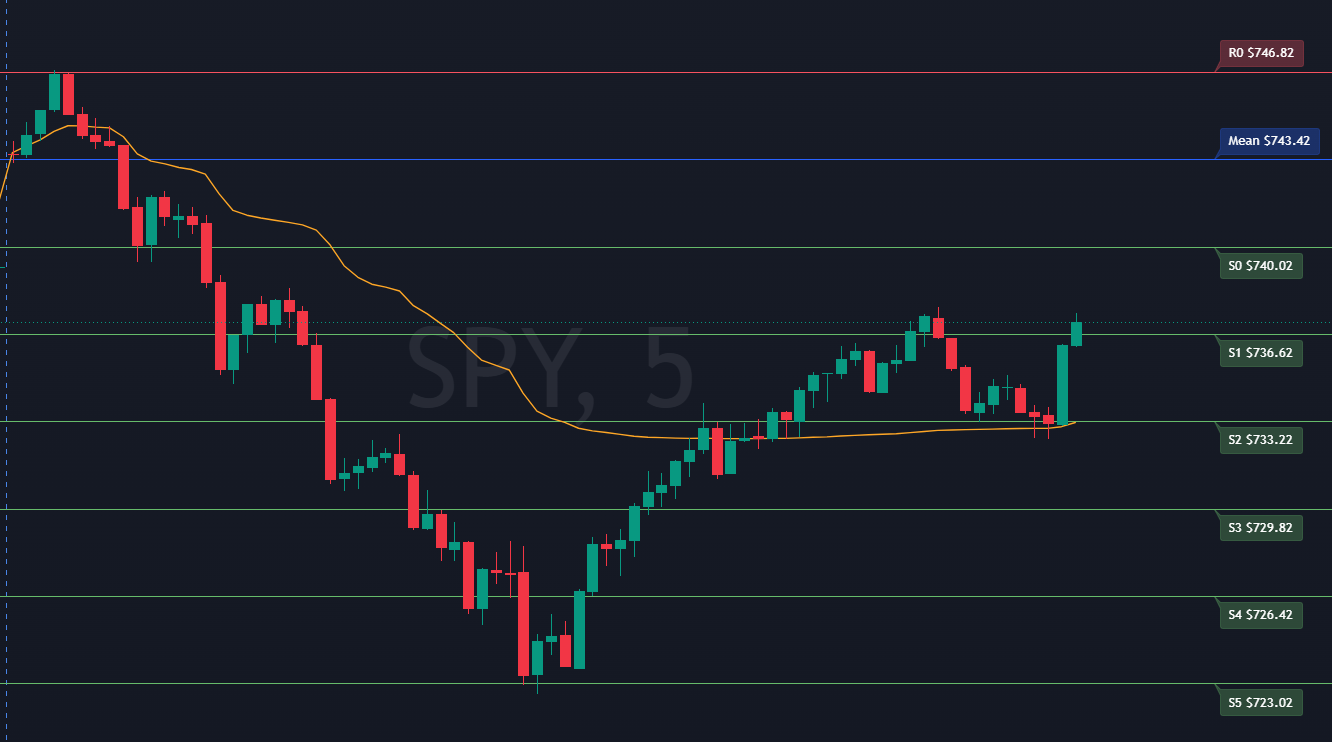
The chart shows the complete story: R0 rejecting the HOD, the cascade through all six support levels, S5 holding as the ultimate floor, the V-shaped recovery back through the broken levels — which now act as resistance on the way up — and VWAP (orange) closing exactly on S2 ($733.22). The session's volume-weighted fair value and the model's second SD band are the same price. The model is bidirectional, and the levels mark where the market's own trading concentrated.

Intraday timeline
Phase 1 — Cascade
9:30 AM
$743.63
Gap up open lands within $0.21 of the model mean ($743.42). The blended anchor pulled the mean up with the gap — the open itself tests the mean as the first structural reference.
HOD
$746.90
High of day. R0 resistance at $746.82 holds within $0.08. Clean rejection — model's first level contains the move with near-perfect precision. Above the flip, dealers are still stabilizing.
Rollover
$739.25
Gamma flip breached. SPY drops through $739.25. Dealers transition from stabilizing to amplifying — every tick lower now forces additional mechanical selling. Cascade begins.
Cascade
$728.55
S3 ($729.82) breaks. S0 → S1 → S2 → S3 all failed in sequence. Each broken level triggered additional dealer selling. SPY now $10.70 below the flip — deep in negative gamma.
Extension
$726.60
S4 ($726.42) approached. Session range from HOD already $20.30 — over 3.5 model standard deviations. Negative charm adding mechanical selling pressure into the afternoon.
LOD
$722.59
S5 ($723.02) undercut by $0.43 before a pivot. All six support levels broken in sequence. Below S5, no further structural levels from the model — cascade selling exhausts itself at the last structural floor.
Phase 2 — V-Shape Recovery
Pivot
$722.59
Cascade selling exhausts at S5. With no further structural support and gamma pressure dissipating at the extreme, mean reversion mechanics engage. VWAP begins to flatten as the session average price anchors a recovery.
Recovery
$733.22
S4 → S3 → S2 reclaimed. Each level that acted as support on the way down now provides a brief pause as resistance on the way back up — then gives way as buying pressure continues. The model ladder is working in both directions.
Afternoon
$734–$736
SPY consolidates between S1 ($736.62) and S2 ($733.22) for the bulk of the afternoon. VWAP flattens and closes exactly on S2 ($733.22) — the session's volume-weighted fair value and the model's second standard deviation band align at the same price. Two independent calculations converging at a model level confirms S2 as the day's structural anchor.
Close
Above S1
A strong green candle at end of day breaks cleanly above S1 ($736.62). The session closes above the level that had capped the recovery all afternoon — the final model waypoint on the recovery ladder cleared. Full session range: open at mean, cascade to S5, recovery through S4/S3/S2, close above S1.
Model level outcomes — cascade and recovery
R0Resistance 0$746.82HELD — rejected HOD within $0.08
μModel Mean$743.42HELD AM open — broken on rollover
Gamma Flip$739.25CASCADE TRIGGER — breach started cascade
S0Support 0$740.02broken in cascade
S1Support 1$736.62broken in cascade · held as resistance PM · cleared at close
S2Support 2$733.22broken in cascade · cleared on recovery
S3Support 3$729.82broken in cascade · cleared on recovery
S4Support 4$726.42broken in cascade · cleared on recovery
S5Support 5 — last floor$723.02HELD as floor — undercut $0.43, then V-pivot
Key lessons from this session
Lesson 1

Prior close within $1 of the gamma flip is a maximum-risk condition

$0.06 above the flip meant any overnight catalyst or pre-market selling would open SPY directly in negative gamma with no structural buffer. When GEX score is 10 and price is this close to the flip, overall exposure should be reduced before the open — not after the cascade begins.

Lesson 2

In Critical Fragility, S/R levels are waypoints — not reversal triggers

Each green support level paused the selling for one or two candles before breaking. Fading any of those levels would have been fading into dealer selling pressure. The correct read during the cascade: use each broken level to track how far the move has extended, not as a trigger to buy.

Lesson 3

Broken support becomes resistance — the model is bidirectional

The V-shape recovery demonstrates the most important structural insight: each level that failed as support during the cascade acted as resistance on the way back up. S4, S3, and S2 each created brief pauses before giving way. The model ladder works in both directions; once you know where price is relative to the levels, you know the next target whether the move is up or down.

Lesson 4

S5 as ultimate floor — cascade exhaustion at the last structural level

Price undercut S5 by only $0.43 before the V-pivot. Even at maximum cascade depth with no further model levels below, S5 carried structural meaning as an exhaustion point. When gamma selling pressure dissipated at the extreme, mean reversion immediately re-engaged — VWAP flattened and the recovery began from the last defined level.

Lesson 5

R0 and the model mean worked precisely — the cascade was a regime event, not a model failure

The open landed within $0.21 of the model mean. R0 held the HOD within $0.08. The SD levels performed as structural references throughout the full session. The cascade was driven by a GEX regime — dealer mechanics amplifying moves below the flip. The model identified that regime pre-market; the levels tracked the session from first tick to close.

Session Range
$24.31
HOD $746.90 → LOD $722.59
Model SDs
3.6×
Normal range: 1–1.5 SDs
Levels Broken
6 / 6
All support levels S0–S5
Close
Above S1
S1 $736.62 cleared at EOD
More sessions added as they occur

Both model validations and failures are documented here — understanding when the model is wrong is as important as knowing when it is right.