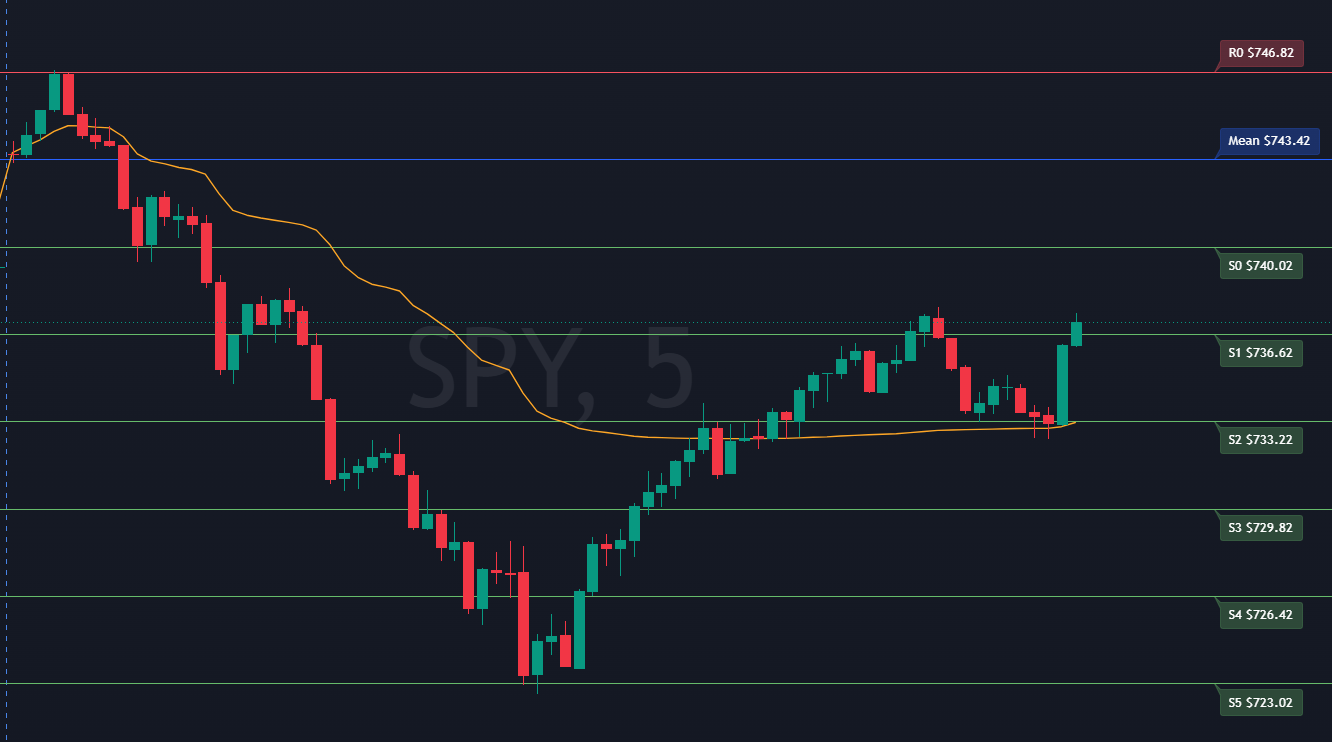
Six resistance levels above the model mean. R0 is the nearest; R5 is the outermost. Color-configurable via the indicator settings.
The blended VWAP/prior-close anchor. The gravitational center price is drawn to throughout the session. Separate color input.
Six support levels below the mean. S0 is nearest; S5 is the last model floor. Color-configurable via the indicator settings.
The regime boundary. Above = dealers stabilizing. Below = dealers amplifying. The most critical level for understanding session risk. Entered manually from the SPY S/R Dashboard.
Longer-term moving averages for context. Optional — leave at 0.00 to hide. Values available from the Market Sentiment Dashboard indices card.
Lines and labels are redrawn at the start of each new trading day. Update the level string input each morning before the open with fresh values from the dashboard.
Copy the indicator code
Use the Copy button on the code block below to copy the full Pine Script to your clipboard.
Open the Pine Script editor in TradingView
In TradingView, click Pine Script Editor at the bottom of the chart window (or press Alt+P). Create a new script, select all existing code, and paste.
Save and add to chart
Click Save, then Add to chart. The indicator will appear as Market-InsightsAI Model SR Levels.
Enter today's values each morning
Open the indicator settings and paste the Pine Script Level String from the SPY S/R Dashboard into the Model SR Levels field. Enter the Gamma Flip from the GEX card. Optionally enter the 50D and 200D SMAs from the Market Sentiment Dashboard. See the input reference below for where to find each value.
The level string from the dashboard is already in the correct format — 13 comma-separated values ordered R5 through S5. Paste it directly with no editing required.
// This Pine Script® code is subject to the terms of the Mozilla Public License 2.0 at https://mozilla.org/MPL/2.0/
// © Gatorcountry

//@version=6
indicator("Market-InsightsAI Model SR Levels", overlay = true)

enum LineStyleOptions
    Solid
    Dashed
    Dotted

sr_levels = input.string("1,1,1,1", "Model SR Levels (comma seperated)")
showLabels = input.bool(true, "Display Labels", "Display Labels on SR Lines")
labelOffset = input.int(10, "Label Offset", tooltip = "The amount of offset (+-) the label is from the last price bar.")

SMA50Day = input.float(0.00, "50 Day Simple Moving Average")
SMA200Day = input.float(0.00, "200 Day Simple Moving Average")
gammaFlip = input.float(0.00, "Gamma Flip")

color support_color = input.color(color.blue, "Support Line Color")
color resistance_color = input.color(color.blue, "Resistance Line Color")
color mean_color = input.color(color.blue, "Mean Line Color")
selectedStyle = input.enum(LineStyleOptions.Solid, "Line Style", options=[LineStyleOptions.Solid, LineStyleOptions.Dashed, LineStyleOptions.Dotted])
line_width = input.int(1, "Line Width")

// Detect the start of a new day
isNewDay = ta.change(time("D")) != 0 or barstate.isfirst

// Convert the enum value to the corresponding line style constant
lineStyleConstant = switch selectedStyle
    LineStyleOptions.Solid => line.style_solid
    LineStyleOptions.Dashed => line.style_dashed
    LineStyleOptions.Dotted => line.style_dotted

levelsArray = str.split(sr_levels, ",")

// Use a 'var' array to track IDs so we can delete them
var lineIDs = array.new_line()
var labelIDs = array.new_label()

var sma50DayLine = line.new(na, na, na, na, extend = extend.both, style = line.style_solid, color = color.white)
var sma50DayLbl = label.new(na, na, text="50D SMA", style=label.style_none, textcolor=color.white)
var sma200DayLine = line.new(na, na, na, na, extend = extend.both, style = line.style_solid, color = color.white)
var sma200DayLbl = label.new(na, na, text="200D SMA", style=label.style_none, textcolor=color.white)
var gammaFlipLine = line.new(na, na, na, na, extend = extend.both, style = line.style_solid, color = color.white)
var gammaFlipLbl = label.new(na, na, text="Gamma Flip", style=label.style_none, textcolor=color.white)

//if it is the start of a new day or the first barstate and the number of items in the input array = 13 (6 resistance, 1 mean and 6 support values)
if isNewDay and array.size(levelsArray) == 13
    // Clear old drawings
    if not na(sma50DayLine)
        line.delete(sma50DayLine)
    if not na(sma50DayLbl)
        label.delete(sma50DayLbl)
    if not na(sma200DayLine)
        line.delete(sma200DayLine)
    if not na(sma200DayLbl)
        label.delete(sma200DayLbl)
    if not na(gammaFlipLine)
        line.delete(gammaFlipLine)
    if not na(gammaFlipLbl)
        label.delete(gammaFlipLbl)

    // Clear old drawings by looping by index
    if array.size(lineIDs) > 0
        for li = 0 to array.size(lineIDs) - 1
            line.delete(array.get(lineIDs, li))
        array.clear(lineIDs)
    if array.size(labelIDs) > 0
        for li = 0 to array.size(labelIDs) - 1
            label.delete(array.get(labelIDs, li))
        array.clear(labelIDs)

    sma50DayLine := line.new(bar_index, SMA50Day, bar_index + 1, SMA50Day, extend = extend.both, style = line.style_solid, color = color.white)
    sma50DayLbl := label.new(bar_index + 5, SMA50Day, "50D SMA $" + str.tostring(SMA50Day), style = label.style_label_lower_left, textcolor = color.white, color = color.gray, size = size.small)
    sma200DayLine := line.new(bar_index, SMA200Day, bar_index + 1, SMA200Day, extend = extend.both, style = line.style_solid, color = color.white)
    sma200DayLbl := label.new(bar_index + 5, SMA200Day, "200D SMA $" + str.tostring(SMA200Day), style = label.style_label_lower_left, textcolor = color.white, color = color.gray, size = size.small)
    gammaFlipLine := line.new(bar_index, gammaFlip, bar_index + 1, gammaFlip, extend = extend.both, style = line.style_solid, color = color.white)
    gammaFlipLbl := label.new(bar_index + 5, gammaFlip, "Gamma Flip $" + str.tostring(gammaFlip), style = label.style_label_lower_left, textcolor = color.white, color = color.gray, size = size.small)

    // Add new drawings by looping by index
    for i = 0 to array.size(levelsArray) - 1
        y = str.tonumber(array.get(levelsArray, i))
        thisColor = i <= 5 ? resistance_color : i == 6 ? mean_color : i >= array.size(levelsArray)-6 ? support_color : color.white
        thisText = i <= 5 ? "R" + str.tostring(math.abs(i - 5)) + " $" + str.tostring(y) : i == 6 ? "Mean $" + str.tostring(y): i >= array.size(levelsArray)-6 ? "S" + str.tostring(i - 7) + " $" + str.tostring(y): "U"
        ln = line.new(bar_index, y, bar_index + 1, y, extend = extend.both, style=lineStyleConstant, color = thisColor, width = line_width)
        array.push(lineIDs, ln)
        if showLabels
            lb = label.new(bar_index + 5, y, thisText, style = i < 7 ? label.style_label_lower_left : label.style_label_upper_left, textcolor = color.white, color = color.new(thisColor, 70), size = size.small)
            array.push(labelIDs, lb)

// This loop runs every bar to "push" the labels to the right edge
if showLabels and array.size(labelIDs) > 0
    label.set_x(sma50DayLbl, bar_index + labelOffset)
    label.set_x(sma200DayLbl, bar_index + labelOffset)
    label.set_x(gammaFlipLbl, bar_index + labelOffset)
    for i = 0 to array.size(labelIDs) - 1
        current_lb = array.get(labelIDs, i)
        label.set_x(current_lb, bar_index + labelOffset)
The indicator only draws when the comma-separated string contains exactly 13 values (R5, R4, R3, R2, R1, R0, Mean, S0, S1, S2, S3, S4, S5). The dashboard Pine Script Level String is always formatted correctly — if lines are not appearing, count the values in your string.
When a new day begins, the indicator clears the previous day's lines and draws fresh ones using the current input values. Update the level string each morning before 9:30 AM ET — the dashboards are generated at 9:15–9:25 AM ET and values are ready well before the open.
The support and resistance levels are most meaningful on intraday timeframes (1m, 5m) where individual level touches, pauses, and breaks are visible as distinct candle reactions.